Skip to content

Create and monitor a study

About this walkthrough

Estimated time: 5 minutes Tags: studies, optimization, core-flow

Configure a study, watch the trials fill in live, and read the terminal state — the core Karpathy loop.

Trouble playing? Download the walkthrough video.

Step 1 — Open the Studies page. Every study you create…

Open the Studies page. Every study you create lands here with its name, cluster, status, the Starting → best metric column (the baseline metric, the best metric the study reached, and the lift between them — with a Pinned at metric ceiling badge if it lands at >= 0.99 on a maximize objective), trial count, convergence verdict (Converged / Improving / Too few trials / em-dash), and timestamps. The seeded completed study sits at the top with its completed status badge, its starting-to-best metric, and convergence verdict — so an operator scanning the list can spot which studies are trustworthy, and how much each one moved the needle, without opening each one. The filter chips along the top scope the list by lifecycle stage (all / queued / running / completed / cancelled / failed).

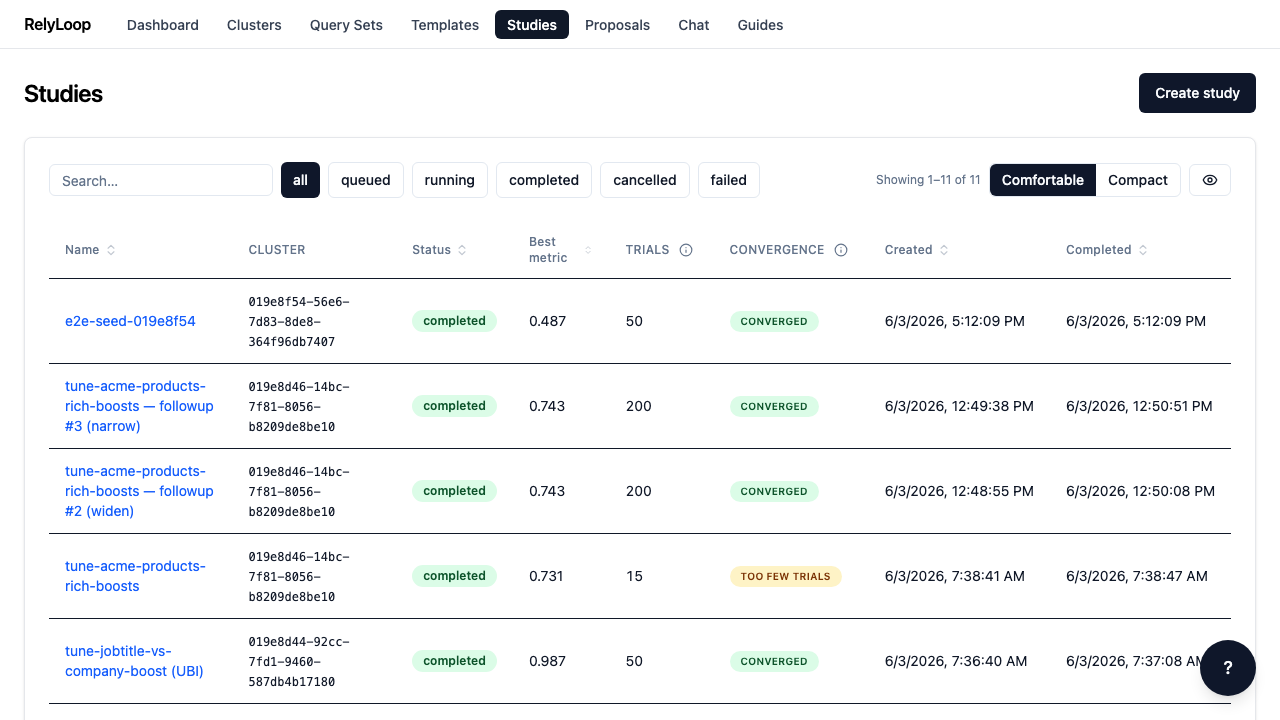
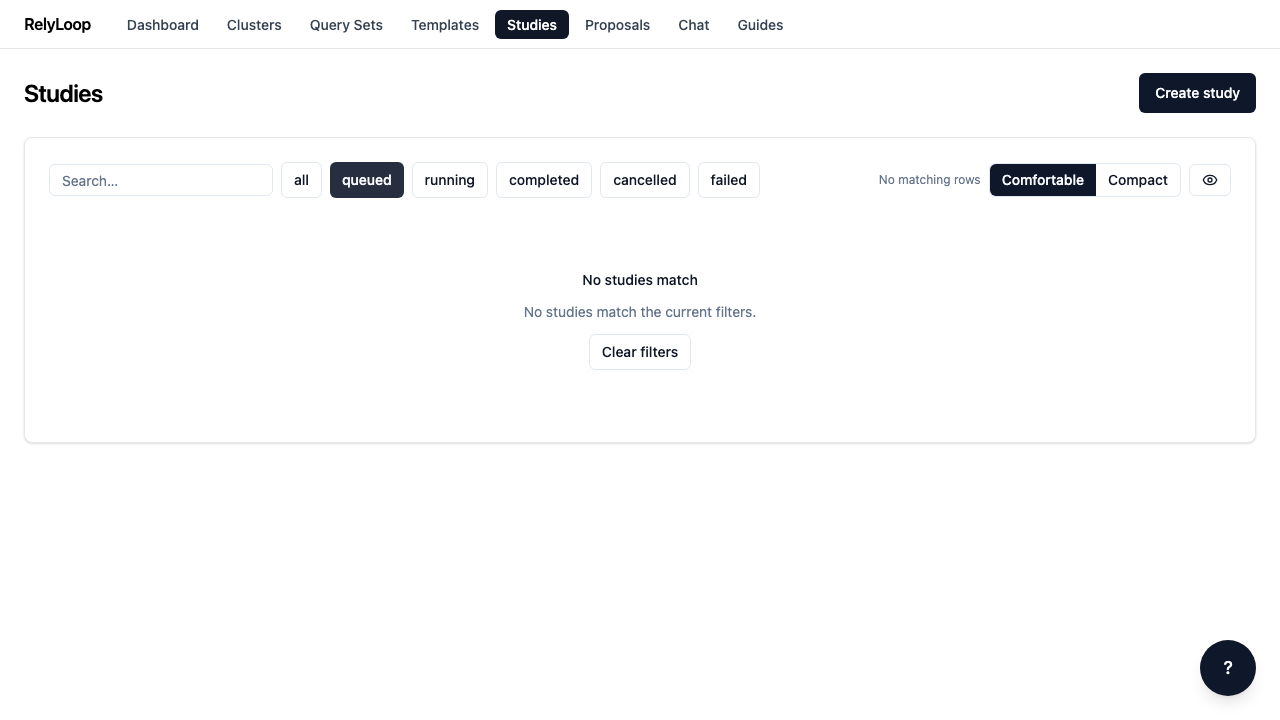
Step 2 — Click 'queued' to filter the list to studies…

Click 'queued' to filter the list to studies waiting for the orchestrator. The URL updates to ?status=queued so the filter is sharable + bookmarkable. The empty state here is expected — the seeded study is already completed, so nothing matches the queued filter. Studies move queued → running → (completed | failed | cancelled) as the orchestrator processes them.

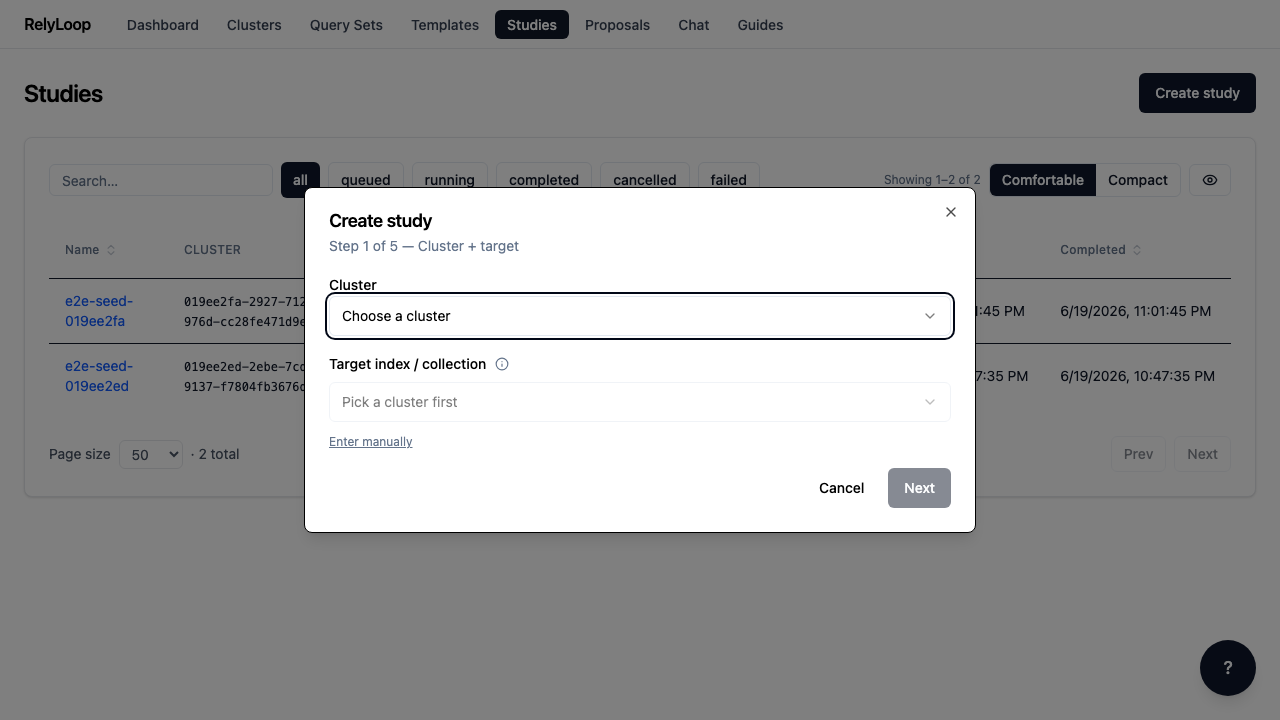
Step 3 — Click 'Create study' to open the multi-step modal.…

Click 'Create study' to open the multi-step modal. Step 1 binds the study to a cluster + target index. The Target field is now a dropdown — it shows the disabled 'Pick a cluster first' placeholder until you pick a cluster, then populates from that cluster's index list (scoped by the cluster's target_filter glob, e.g. products* for an e-commerce cluster). The 'Enter manually' toggle below the field is always visible and falls back to a free-text input — useful when the operator-supplied glob is restrictive or the cluster returns 403 on index listing. Subsequent wizard steps pick the query set + judgment list, the query template, the search-space (which params Optuna will vary + their ranges), and the objective metric + budget.

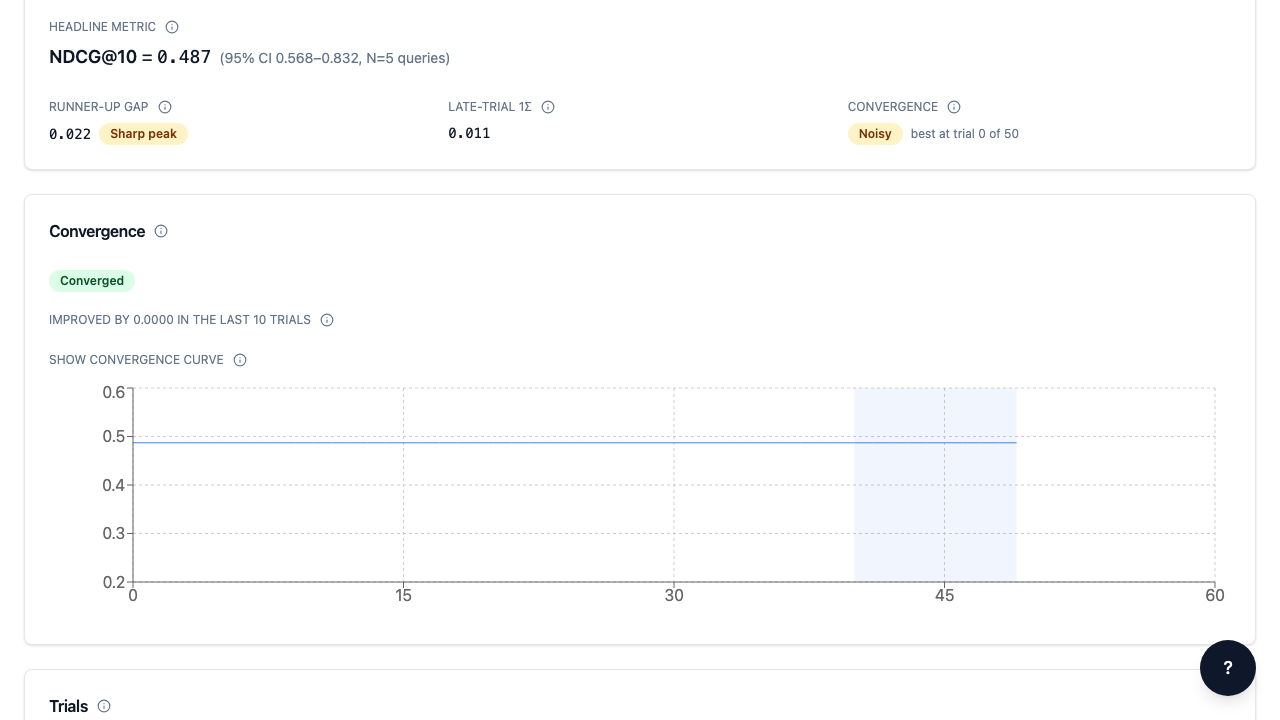
Step 4 — The detail page is where the operator spends…

The detail page is where the operator spends real time. Above the header card, a short summary paragraph explains what a study is. Below the header, the **linked-entities row** shows named, clickable links to the cluster, query set, judgment list, and template the study ran against — so operators don't have to grep UUIDs. When a proposal has been promoted from this study, a **view-proposal** link appears below the linked entities for the round-trip from study → proposal. The **Confidence** panel between the header and the trials table answers *'is this winner statistically reliable?'* — it surfaces the headline metric with a 95% CI band, per-query outcome chips (Improved / Unchanged / Regressed vs. the runner-up or baseline), named *Queries that improved* and *Queries that regressed* tables when those counts are > 0, and three secondary callouts (runner-up gap, late-trial 1σ, convergence regime). Below it, the **Convergence** panel answers a different question — *'did the optimizer finish learning, or did I stop too early?'* — with a plain-language verdict (here: **Converged**), an 'improved by N in the last W trials' summary, and an expandable best-so-far metric curve. Every (i) icon opens a glossary definition. The trials table below auto-polls every 3 seconds while the study is running.

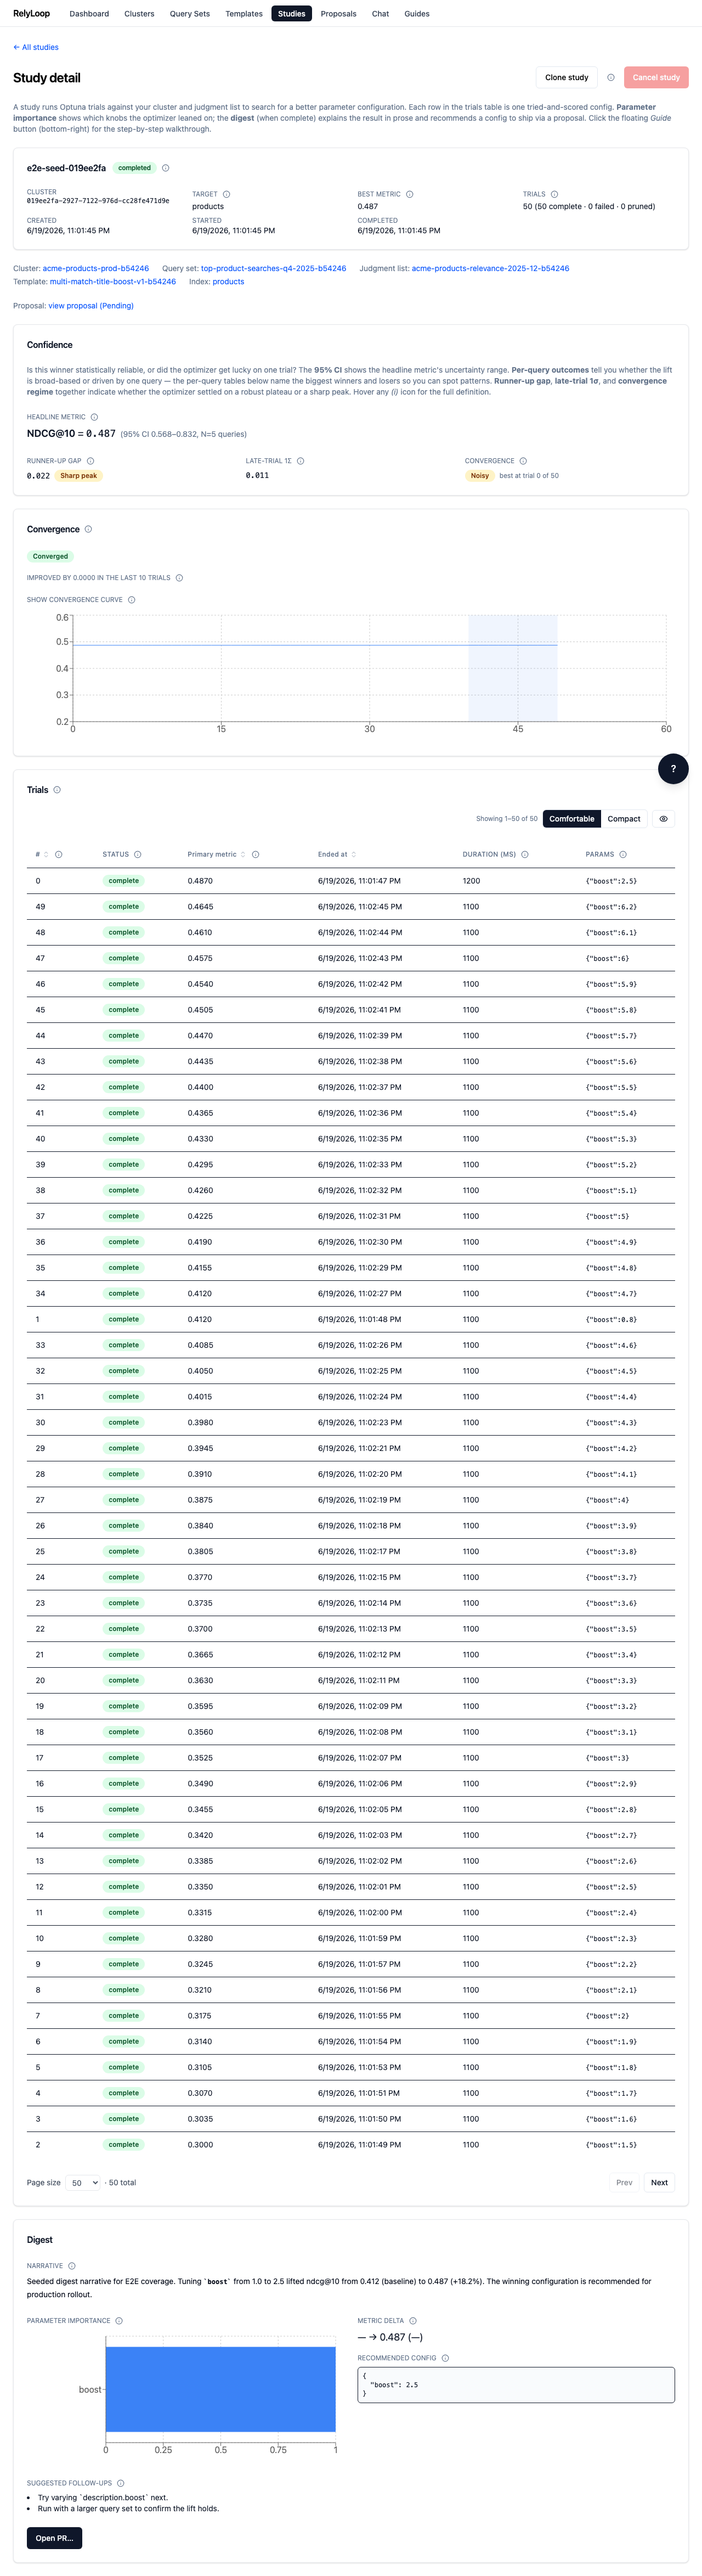
Step 5 — Terminal state, viewport view. Once max_trials is reached…

Terminal state, viewport view. Once max_trials is reached (or the operator cancels via the 'Cancel study' button, which fires POST /api/v1/studies/{id}/cancel), the status moves to a terminal value and the Cancel button is grayed out. Cancellation is graceful — in-flight trials complete cleanly; no new trials enqueue. The linked-entities row + view-proposal link sit prominently above the Confidence panel: this is where an operator clicks through to the proposal that the orchestrator emitted when this study completed. Once terminal, the orchestrator emits a digest + (when judgments meet the quality threshold) a pending proposal that you'll review on the Proposals page.

← Back to walkthroughs